| 失效链接处理 |
|
MySQL OCP 5.6题库标准答案 PDF 下载
本站整理下载:
相关截图:

主要内容:
前言
题目基于网上流出的题库整理,来源于"1Z0-883 V9.02 5.6DBA.pdf"
未经作者允许禁止复制传阅群外人员,更不能用于商业用途 (群号见文档底部)
答案均为作者整理,自认为正确率较高
为了激发读者自主学习性,答案不提供解题思路和过程
本文档修复了"1Z0-883 V9.02 5.6DBA.pdf"的各种错误,包括标点符号、拼写错误、大小写错误、
逻辑错误,并且进行了重新排版,尽量去掉图片,换成可以方便复制和测试的SQL语句,花费了大量
的时间。本文档不收费,如有错误之处欢迎指出。欢迎打赏,有技术问题也可以咨询我,欢迎添加作
者微信。
约定
都是5.6的答案,5.7答案有区别时会有特别指出
开始
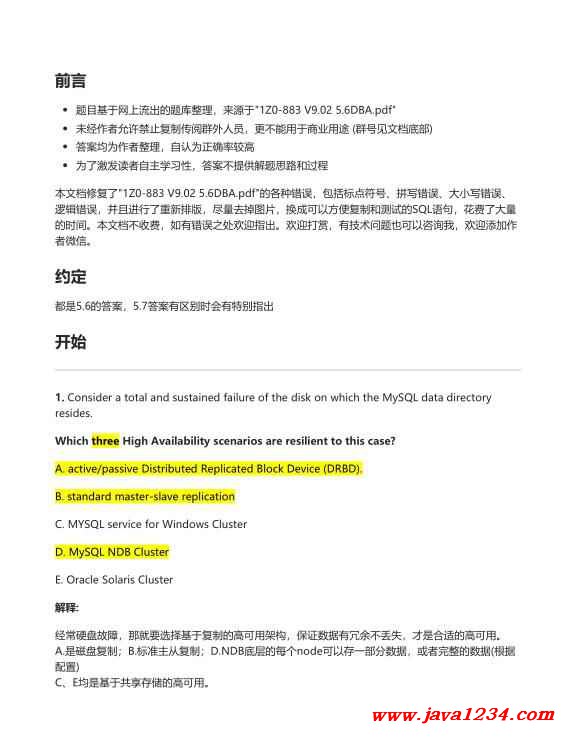
1. Consider a total and sustained failure of the disk on which the MySQL data directory
resides.
Which three High Availability scenarios are resilient to this case?
A. active/passive Distributed Replicated Block Device (DRBD).
B. standard master-slave replication
C. MYSQL service for Windows Cluster
D. MySQL NDB Cluster
E. Oracle Solaris Cluster
解释:
经常硬盘故障,那就要选择基于复制的高可用架构,保证数据有冗余不丢失,才是合适的高可用。
A.是磁盘复制;B.标准主从复制;D.NDB底层的每个node可以存一部分数据,或者完整的数据(根据
配置)
C、E均是基于共享存储的高可用。
2. You want to start monitoring statistics on the distribution of storage engines that are
being used and the average sizes of tables in the various databases. Some details are as
follows:
The MySQL instance has 400 databases.
Each database on an average consists of 25-50 tables. You use the query:
SELECT TABLE_SCHEMA,
`ENGINE`, COUNT(*) ,
SUM(data_length) total_size
FROM INFORMATION_SCHEMA.TABLES
WHERE TABLE_TYPE = 'BASE TABLE'
GROUP BY TABLE_SCHEMA, ENGINE;
Why is this query slow to execute?
A. Counting and summarizing all table pages in the InnoDB shared tablespace is time
consuming.
B. Collecting information requires various disk-level operations and is time consuming.
C. Aggregating details from various storage engine caches for the final output is time
consuming.
D. Collecting information requires large numbers of locks on various
INFORMATION_SCHEMA tables, thereby causing contention.
3. A database exists as a read-intensive server that is operating with query_cache_type =
DEMAND. The dataset is refreshed periodically, but the resultset size of the queries does not
fluctuate. Note the following details about this environment:
A web application uses a limited set of queries.
The Query Cache hit rate is high.
All resultsets fit into the Query Cache.
All queries are configured to use the Query Cache successfully. The response times for
queries have recently started to Increase. The cause for this has correctly been identified
as the increase in the number of concurrent users accessing the web service.
Based solely on the information provided, what is the most likely cause for this
slowdown at the database level?
A. The Query Cache Is pruning queries due to an Increased number of requests.
B. query_cache_min_res_unit has been exceeded, leading to an increased performance
overhead due to additional memory block lookups.
|


 苏公网安备 32061202001004号


